Authors: Domenic V. Cicchetti, Donald Showalter, Peter J Tyrer
Date: 1985
Summary:
Critique:
The authors study how the inter-rater reliability of a clinical rating scale is affected by the scale points by using a computer simulation. There are not guidelines that exist to know how many categories or scale points to employ. Other studies have not determined the optimal number of points on a scale due to the sample sizes being too small; assembled findings that are probably sample specific; computer simulations that have employed only 100 simulations (may be too few for sound results); methodologies for the studies have varied, so it becomes impractical to accurately compare results. Most commonly used reliability statistics have been coefficient alpha or Pearson product-moment correlation coefficient. Coefficient alpha is used often when measuring inter-rater reliability (the degree of agreement amongst raters), yet seriously criticized in not measuring what its intended for.
Using the monte carlo method, the authors address “How does inter-rater reliability, under a variety of different conditions, compare for dichotomous, ordinal, and continuous scales of measurement.” The authors employ a test with proper reliability statistics, a sufficient sample size, and a practical number of computer simulations. A series of parameters to answer the question were mixed and put in, resulting in 240 conditions. Below are the parameters.
1. The scale of measurement; (a) categorical-dichotomous (2 categories); (b) ordinal (3 ≤ k ≤ 10) categories of classification; and (c) continuous (dimensional) scale of measurement (i.e., 15 % k % 100 scale points).
2. The average level of simulated absolute interrater agreement: 30%, 50%, 60%, or 701E (on the average), across the main diagonal of a Rater I x Rater 2 contingency table. These levels were chosen in order to be consonant with clinical applications; this strategy stands in distinct contrast to allowing levels of interrater agreement to simply vary about chance expectancies.
3. The average proportion of cases in which one simulated rater gave higher scores than the other when the two raters were not in complete agreement: 50/50 split on the off-diagonals, 9 60/40 split, 70/30 split, or 90/10 split.
4. The sample size or N for each computer simulation was 200, based on the results of monte carlo
5. Given the very large number of possible rater pairings as “k” approached 100 (here 10,000), it was considered appropriate to utilize 10,000 as the number of computer runs per simulated condition. In previous research k was also taken into account in deciding on the number of runs to employ.
In selecting an inter-rater reliability statistic, below are the criteria considered…
1. It would measure levels of interrater agreement rather than similarity in the ordering of rater rankings,
2. It would correct for the amount of agreement expected on the basis of chance alone, and
3. It could be validly applied to all three types of scales that were investigated (categorical-dichotomous, ordinal, and continuous/dimensional).
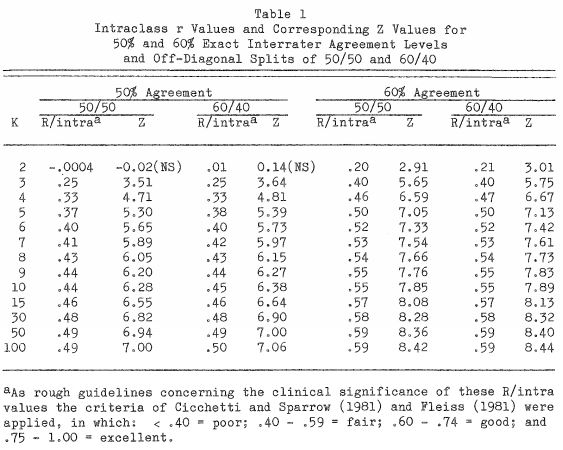
Unfortunately, meaningless effects can show significant value. The authors make sure the number generators produce purposeful simulations before assessing the results. The strategy was in agreement with the new factors they applied (based off of findings from previous literature), to test the study properly. Results show that there is a pattern in each level of complete inter-rater agreement in the 30%, 50%, 60%, and 70% range, and in the four off-diagonal splits, 50/50, 60/40, 70/30, or 90/10.

After examining the results, inter-rater agreement is low for a 2 point scale; sometimes with no statistical significance, and was always statistically significant for 3 or more classification categories. It is apparent that the reliability levels are always increasing, and from 7 to 100; the increase is not dramatic or as significant as it is between 2 and 7. The authors conclude that reliability increases up to 7 scale points. To optimize the probability of generating a more reliable scale, 7 number (plus or minus two) is the most sufficient point scale.
Monte carlo is definitely an extraordinary method and produces reliable results, but entirely dependent on the input. The input has to be accurate in order to generate a valid output. I am not sure how useful it would be in intelligence, but it seems it can be a powerful method. When employing the method, the key is to understand how monte carlo should be applied in order to understand its full potential.


 Posts

