Authors: Domenic V. Cicchetti, Donald Showalter, Peter J Tyrer
Date: 1985
Summary:
Critique:
The authors study how the inter-rater reliability of a clinical rating scale is affected by the scale points by using a computer simulation. There are not guidelines that exist to know how many categories or scale points to employ. Other studies have not determined the optimal number of points on a scale due to the sample sizes being too small; assembled findings that are probably sample specific; computer simulations that have employed only 100 simulations (may be too few for sound results); methodologies for the studies have varied, so it becomes impractical to accurately compare results. Most commonly used reliability statistics have been coefficient alpha or Pearson product-moment correlation coefficient. Coefficient alpha is used often when measuring inter-rater reliability (the degree of agreement amongst raters), yet seriously criticized in not measuring what its intended for.
Using the monte carlo method, the authors address “How does inter-rater reliability, under a variety of different conditions, compare for dichotomous, ordinal, and continuous scales of measurement.” The authors employ a test with proper reliability statistics, a sufficient sample size, and a practical number of computer simulations. A series of parameters to answer the question were mixed and put in, resulting in 240 conditions. Below are the parameters.
1. The scale of measurement; (a) categorical-dichotomous (2 categories); (b) ordinal (3 ≤ k ≤ 10) categories of classification; and (c) continuous (dimensional) scale of measurement (i.e., 15 % k % 100 scale points).
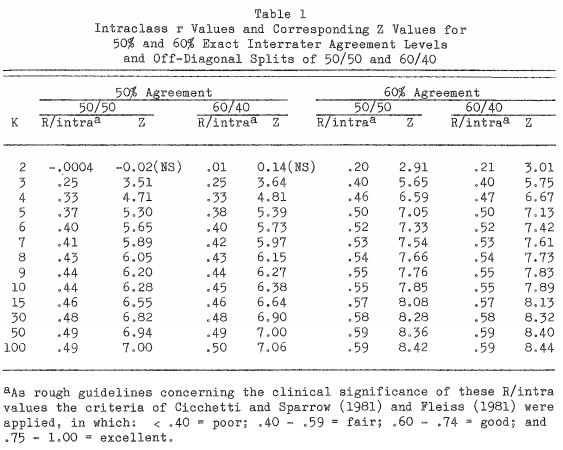
2. The average level of simulated absolute interrater agreement: 30%, 50%, 60%, or 701E (on the average), across the main diagonal of a Rater I x Rater 2 contingency table. These levels were chosen in order to be consonant with clinical applications; this strategy stands in distinct contrast to allowing levels of interrater agreement to simply vary about chance expectancies.
3. The average proportion of cases in which one simulated rater gave higher scores than the other when the two raters were not in complete agreement: 50/50 split on the off-diagonals, 9 60/40 split, 70/30 split, or 90/10 split.
4. The sample size or N for each computer simulation was 200, based on the results of monte carlo
5. Given the very large number of possible rater pairings as “k” approached 100 (here 10,000), it was considered appropriate to utilize 10,000 as the number of computer runs per simulated condition. In previous research k was also taken into account in deciding on the number of runs to employ.
In selecting an inter-rater reliability statistic, below are the criteria considered…
1. It would measure levels of interrater agreement rather than similarity in the ordering of rater rankings,
2. It would correct for the amount of agreement expected on the basis of chance alone, and
3. It could be validly applied to all three types of scales that were investigated (categorical-dichotomous, ordinal, and continuous/dimensional).
Unfortunately, meaningless effects can show significant value. The authors make sure the number generators produce purposeful simulations before assessing the results. The strategy was in agreement with the new factors they applied (based off of findings from previous literature), to test the study properly. Results show that there is a pattern in each level of complete inter-rater agreement in the 30%, 50%, 60%, and 70% range, and in the four off-diagonal splits, 50/50, 60/40, 70/30, or 90/10.

After examining the results, inter-rater agreement is low for a 2 point scale; sometimes with no statistical significance, and was always statistically significant for 3 or more classification categories. It is apparent that the reliability levels are always increasing, and from 7 to 100; the increase is not dramatic or as significant as it is between 2 and 7. The authors conclude that reliability increases up to 7 scale points. To optimize the probability of generating a more reliable scale, 7 number (plus or minus two) is the most sufficient point scale.
Monte carlo is definitely an extraordinary method and produces reliable results, but entirely dependent on the input. The input has to be accurate in order to generate a valid output. I am not sure how useful it would be in intelligence, but it seems it can be a powerful method. When employing the method, the key is to understand how monte carlo should be applied in order to understand its full potential.


People TEND to exhibit three biases when filling out rating scales, they (1) avoid extremes, (2) agree with statements as presented, (3) portray themselves or the group in a favorable light. Consider using a 9 point scale, justifying this choice by the research on inter-rater reliability, such as "1"=strongly disagree, "5"=neither agree nor disagree, and "9"=strongly agree (in "quotes" since we all know these are not really numbers, they are positions in a list). Now consider the situation in which 2 people vote "3", 6 vote "4", 1 votes "5" and 1 votes "6". Clearly the weight of votes (8 of them, i.e. 80%) are to the left of neutral on the disagree side of the scale. So do 80% of the expert panel disagree?
ReplyDeleteWell, that depends ...
If, as all too frequently happens, the decision maker wants a "give me the simple result, just tell me the level of agreement, disagreement and can't make their minds up!" one can now completely reverse the report. Simplify the chart by breaking scale points "1", "2" and "3" into "Disagree", points "4", "5" and "6" into "Neutral, and points "7", "8" and "9" into "Agree", and report back to the decision maker "Only 20% of the expert group disagree sir!"
9 point scales, good inter-rater reliability, easily manipulatable thanks to human bias by the rater AND the decision maker!
Stephen,
DeleteA slew of researchers, beginning with Bendig (1954) have found a relatively constant inter-rater reliability over scales with 3, 5, 7, and 9 response categories. This reliability decreases in most studies around 11 partitions. If its true those variables are independent of one another, would you then suggest controlling the human bias and manipulation variables by decreasing the scale? Just looking at it logically, decreasing the partitions would decrease the rater/DMs ability to manipulate.
I would not decrease the scale, I would if possible train the responders to recognize the bias. The manipulation is a possibility the decision maker in receipt of the analysis results must be aware of. Decreasing the scale removes the possibility of nuance. It's not he scale as such that is the problem or the resource, it's the process one uses with the raters for eliciting their ratings that is important.
DeleteI'm aware we are talking specifically about response categories in rating scales such as the Likert scale, but I'd like to try and pivot to intelligence. If 9-point scales add nuance, would you suggest that our NIEs should shift from using a 7-point scale to using a 9-point scale?
DeleteNo, I am just pointing out how the larger scale is more easily manipulatable based on the interaction between two different biases, one for the raters and another for the decision maker. Just because we have a benefit (reliability) from a structure does not mean we can ignore downsides of that structure.
DeleteThis comment has been removed by the author.
ReplyDeleteChelsie,
ReplyDeleteThis was a very interesting article that touches on two important issues for an analyst: the use of scales to collect information from respondents and an analytic method with MC simulations. I find that the MC simulation supporting the phenomenon of the "magic number 7, plus or minus 2" to be fascinating. Thanks for sharing!
Chelsie, I agree with your critique of MC simulations. In my article authors talked about using MC simulations to evaluate the risks in certain investments. They were able to do this in an affective way. However, it comes back to they had nice clean data to input. That plays a role in the significance of the findings. I enjoyed your post!
ReplyDelete